Scrap metal is more than just wasteits a global commodity that responds to supply, demand, and economic cycles. For sellers and buyers, understanding 10-year scrap metal price trends provides valuable insights into when to trade, how to forecast profitability, and what to expect in the future.
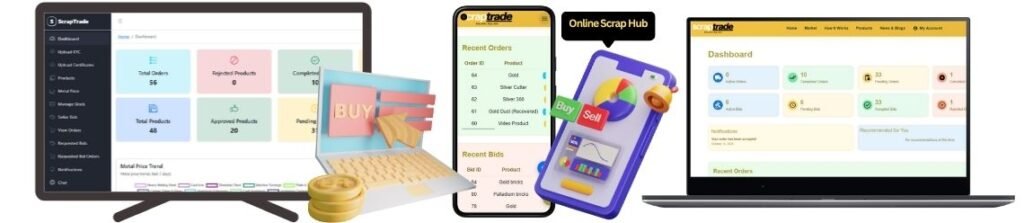
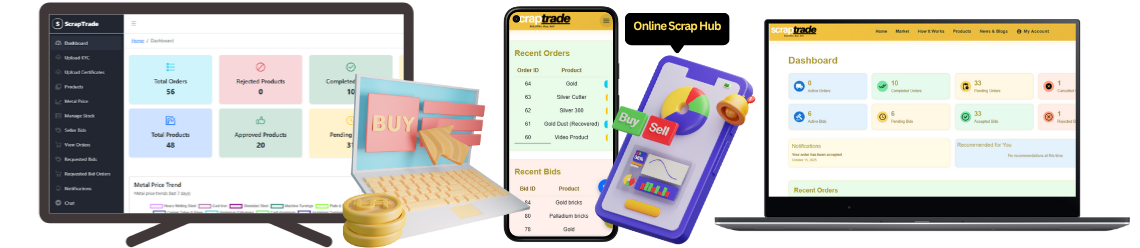
With ScrapTrade, you dont just get todays priceyou gain access to an intelligent scrap trading platform where real-time data, verified buyers, and secure transactions make trading smarter and more profitable.
Why Look at Scrap Metal Prices Over 10 Years?
Scrap prices are notoriously volatile. By reviewing scrap metal price charts across a decade, you can see:
- Global Economic Impact Recessions, booms, and trade wars leave clear marks on scrap values.
- Commodity Demand Shifts Growing industries (like EV batteries) increase demand for certain metals.
- Sustainability Trends Recycling and green policies push up demand for secondary metals.
- Supply Constraints Mine closures, shipping delays, and political disruptions affect global flows.
In short: price charts tell the story of the scrap economy and help you make better trading decisions today.
Scrap Metal Price Trends: 20132023 (Overview)
Heres a broad look at how major metals have performed globally over the last 10 years. Figures vary by region, but the trend lines remain consistent.
Copper Prices (20132023)
- Averaged $6,000$7,000 per ton for most of the decade.
- Dipped during 20152016 due to oversupply and slowing Chinese demand.
- Reached record highs above $10,000 per ton in 20212022, driven by renewable energy and EV growth.
Aluminium Prices (20132023)
- Stayed relatively stable at $1,500$1,900 per ton for years.
- Climbed past $3,000 per ton in 2021 due to energy costs and supply chain disruptions.
Steel Scrap Prices (20132023)
- Known for sharp swings, typically $200$400 per ton.
- Hit lows in 2015 but surged post-2020 with construction demand and reduced supply.
Lead Prices (20132023)
- Averaged $1,800$2,200 per ton, fairly stable due to consistent battery recycling demand.
- Spikes aligned with automotive industry cycles.
Scrap Metal Prices Chart (10-Year Snapshot)
(Indicative global averages, rounded for readability)
| Year | Copper ($/ton) | Aluminium ($/ton) | Steel Scrap ($/ton) | Lead ($/ton) |
|---|---|---|---|---|
| 2013 | ~7,200 | ~1,800 | ~350 | ~2,200 |
| 2015 | ~5,000 | ~1,550 | ~200 | ~1,700 |
| 2018 | ~6,300 | ~1,950 | ~330 | ~2,100 |
| 2020 | ~6,000 | ~1,700 | ~250 | ~1,900 |
| 2021 | ~9,500 | ~2,800 | ~500 | ~2,200 |
| 2023 | ~8,400 | ~2,600 | ~400 | ~2,000 |
Source: Compiled from international commodity market data.
What This Means for Todays Sellers
- Copper is King: Always among the most profitable scrap metals, with strong upward trends driven by electrification.
- Steel & Aluminium Depend on Construction: These metals rise and fall with building and infrastructure cycles.
- Lead Remains Steady: Demand is tied to batteries, making it less volatile than others.
For sellers, this means that timing matters. Selling when demand spikes can increase profits by hundreds (or thousands) per ton.
How ScrapTrade Helps You Maximize Value
Historical charts are useful, but your profits depend on todays price. Thats where ScrapTrade gives you the edge.
- Live Market Data Real-time insights, not outdated quotes.
- Verified Buyers Connect only with trusted scrap buyers.
- Competitive Bidding Ensure you get the best possible rate.
- Escrow Security Payments are safe until the deal is complete.
- Logistics Support Whether youre selling a ton or a truckload, ScrapTrade makes collection easy.
Start here:
Final Thoughts: Learn from the Past, Trade for the Future
The 10-year scrap metal price chart shows a clear pattern: markets rise, fall, and rise again. Sellers who stay informed and use secure, transparent platforms like ScrapTrade are always in the best position to profit.
Whether youre selling copper wiring in Sydney, aluminium sheets in Melbourne, or steel scrap in Brisbane, ScrapTrade connects you to the right buyersbacked by real-time pricing and safe payments.